Hebron — once the home ofthree cotton ginsand a post office — is a tiny town of about 400 residents sandwiched between two affluent suburbs of Dallas-Fort Worth, TX. To the north of Hebron is The Colony. To the south is Carrollton. Certainly, those two thriving suburbs overshadowlittle ol’Hebron.
Yet the small suburb of Hebron provides a perfect way to illustrate the recent burst of growth in Dallas-Fort Worth. From July 2015 to July 2016, the region added 393 residents per day, according tonew estimates from the U.S. Census Bureau. In other words, the Dallas-Fort Worth area essentially added one town the size of Hebron every day over the course of 365 days.
At a 393-per-day stride, Dallas-Fort Worth tacked on more residents every day from 2015 to 2016 than any other metro area in the country, according to a LawnStarter analysis of Census Bureau data. In second place is Dallas-Fort Worth’s neighbor to the southeast, Houston, TX. From 2015 to 2016, the Houston area added 342 residents per day.
While Dallas-Fort Worth might not be able to maintain apaceof nearly 400 new residents per day, the region is projected to keep experiencing substantial growth. One key reason: jobs.
“The Dallas region continues to be a job creation engine — a very attractive reason for people to consider moving to our area,” says Eric Griffin,managing director of research at theDallas Regional Chamber.

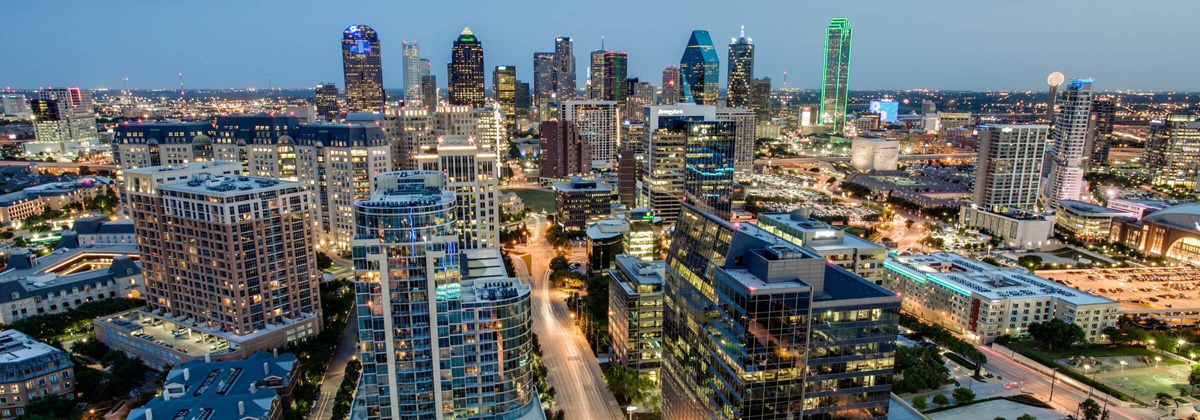
Job growth is spurring population growth in Dallas-Fort Worth.
Photo:Visit Dallas
Griffin says that from late 2016 to early 2017, only one region — New York, NY — had created more jobs than Dallas-Fort Worth.
Aside from where they can work, people are drawn to Dallas-Fort Worth because of where they can live.
“Dallas suburbs consistently rank in the top 10 in the nation for quality-of-life issues including ‘best places for young families,’ ‘best places to live’ and ‘best places for business, careers and jobs,’” Griffin says.
In the chart below, see the 19 metro areas that gained at least 100 residents per day from 2015 to 2016.
19日地铁区域至少100 Residen补充道ts Per Day in 2015-16
| Metro area | 2015-16 population gain | # new residents per day | 2016 population | % increase 2015-16 |
|---|---|---|---|---|
| Dallas-Fort Worth, TX | 143,435 | 393 | 7,233,323 | 2.00% |
| Houston, TX | 125,005 | 342 | 6,772,470 | 1.90% |
| Phoenix, AZ | 93,680 | 257 | 4,661,537 | 2.10% |
| Atlanta, GA | 90,650 | 248 | 5,789,700 | 1.60% |
| Seattle, WA | 71,805 | 197 | 3,798,902 | 1.90% |
| Miami, FL | 64,670 | 177 | 6,066,387 | 1.10% |
| Tampa, FL | 61,085 | 167 | 3,032,171 | 2.10% |
| Orlando, FL | 59,125 | 162 | 2,441,257 | 2.50% |
| Austin, TX | 58,301 | 160 | 2,056,405 | 2.90% |
| Washington, DC | 53,508 | 147 | 6,131,977 | 0.90% |
| Riverside-San Bernardino, CA | 52,400 | 144 | 4,527,837 | 1.20% |
| Charlotte, NC | 49,671 | 136 | 2,474,314 | 2.00% |
| San Antonio, TX | 47,906 | 131 | 2,429,609 | 2.00% |
| Las Vegas, NV | 46,375 | 127 | 2,155,664 | 2.20% |
| Denver, CO | 44,261 | 121 | 2,853,077 | 1.60% |
| Los Angeles, CA | 41,619 | 114 | 13,310,447 | 0.30% |
| Portland, OR | 40,148 | 110 | 2,424,955 | 1.70% |
| San Francisco, CA | 36,939 | 101 | 4,679,166 | 0.80% |
| Nashville, TN | 36,337 | 100 | 1,865,298 | 2.00% |
| Source: U.S. Census Bureau |
Need help tending to your lawn? Visit ourDallas lawn carepage for more info! In addition to Dallas, we also provide lawn care service inPlano,Denton,Irving, andGrand Prarie.
Top photo:Cyber Security Summit